Intro
In this blog post, I will show how to configure Akamai DataStream and how to use Sumo Logic to look at raw log data and aggregated metrics provided by this product.
What’s Hot?
Have you checked the previous Your Application at the Edge [S01E04] post? It details how to use the Akamai Monitoring tool under Akamai Control Center to analyse user traffic stats and well as how to use WebPageTest to understand the website performance.
What’s DataStream?
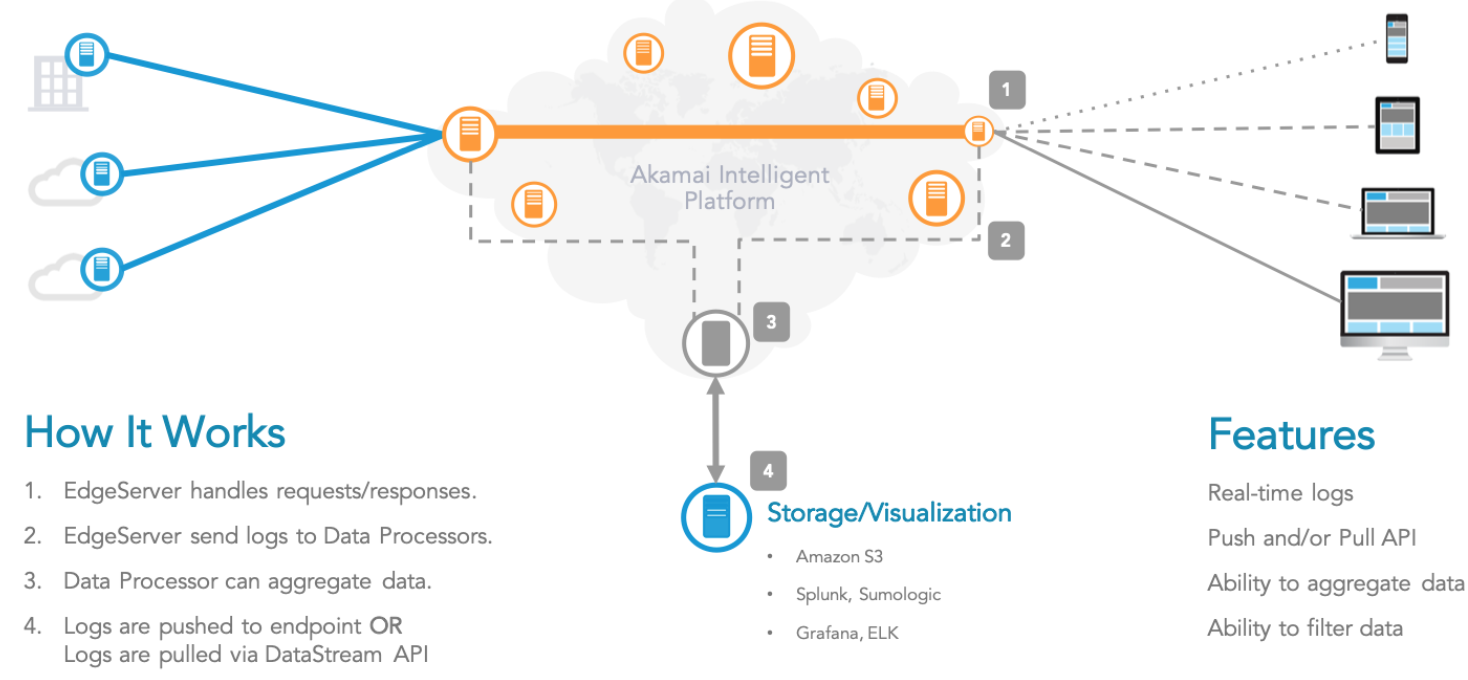
DataStream brings real-time visibility of CDN performance with customised data logs and aggregated metrics on traffic, errors and events. It provides raw logs as well as aggregated metrics through PUSH & PULL API’s, for agile and reliable CI/CD (continuous integration and continuous development) DevOps practices for a client’s CDN configurations and digital applications.
 |
|---|
| Figure 1: Akamai’s DataStream Architecture. |
How To Configure DataStream
DataStream is very easy to configure, just follow the steps below:
- Go to the Main Manu and click on “Show all Service” and then search for DataStream and click on “Real-time logs”.
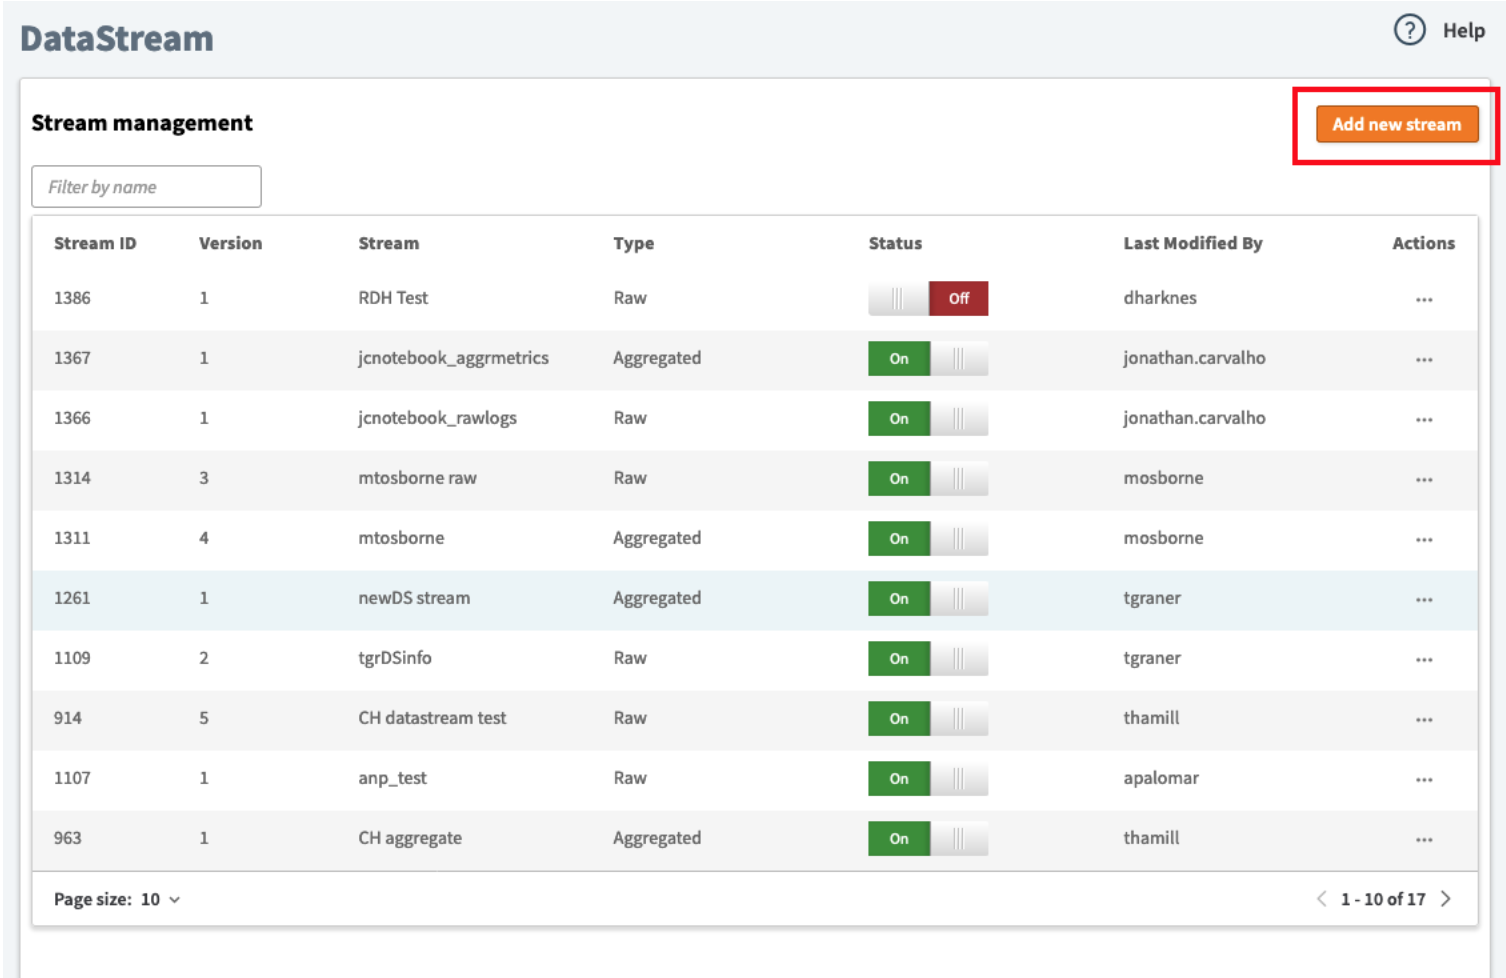
- You will see the Stream management interface and here just add a new stream.
 |
|---|
| Figure 2: Adding a new Stream. |
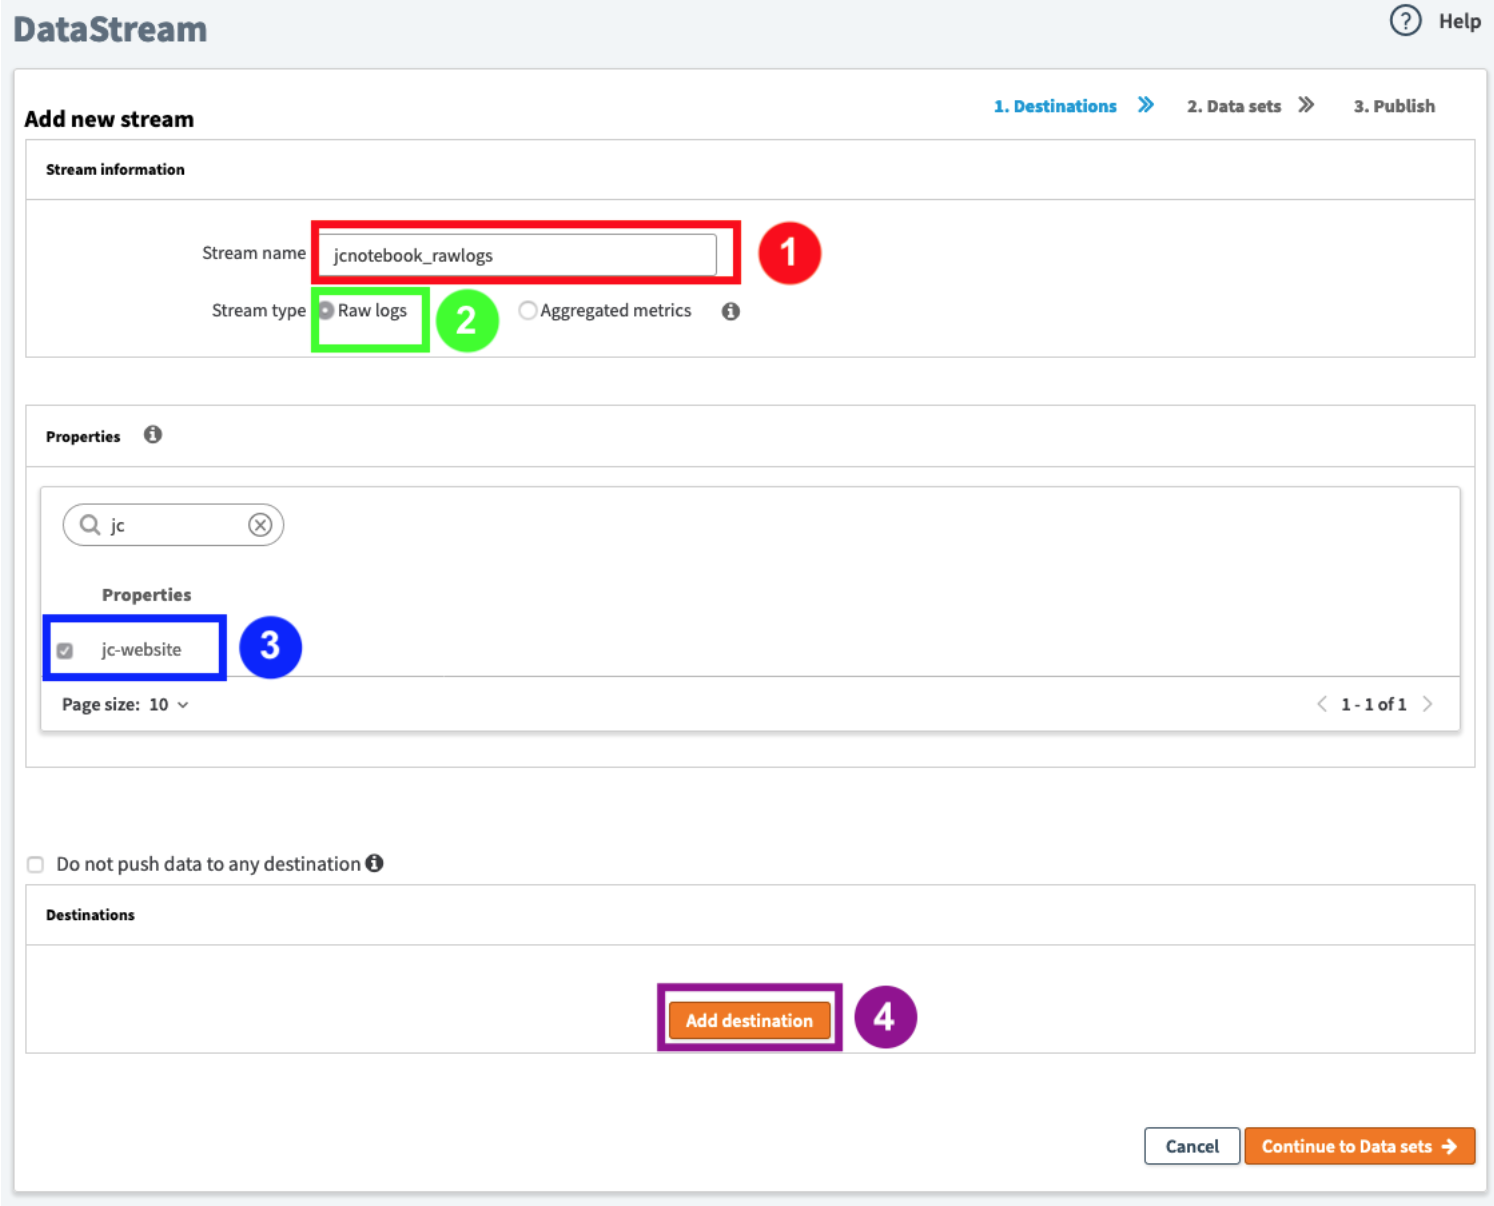
- Give the stream a name, select one of the two options (Raw logs or Aggregated metrics), and select the property that you’d like to monitor. In the case, you’d like to push the data to Sumo Logic, Splunk or S3 please click on “Add destination”. In my case, I’ve got a Sumo logic account and I will be pushing the data to my Sumo Logic Endpoint.
 |
|---|
| Figure 3: Adding the Stream details. |
- Add the Destination name and the Sumo Logic/Splunk/S3 endpoints URL – Please see the section below on how to get the Sumo Logic Destination name and endpoint URL.
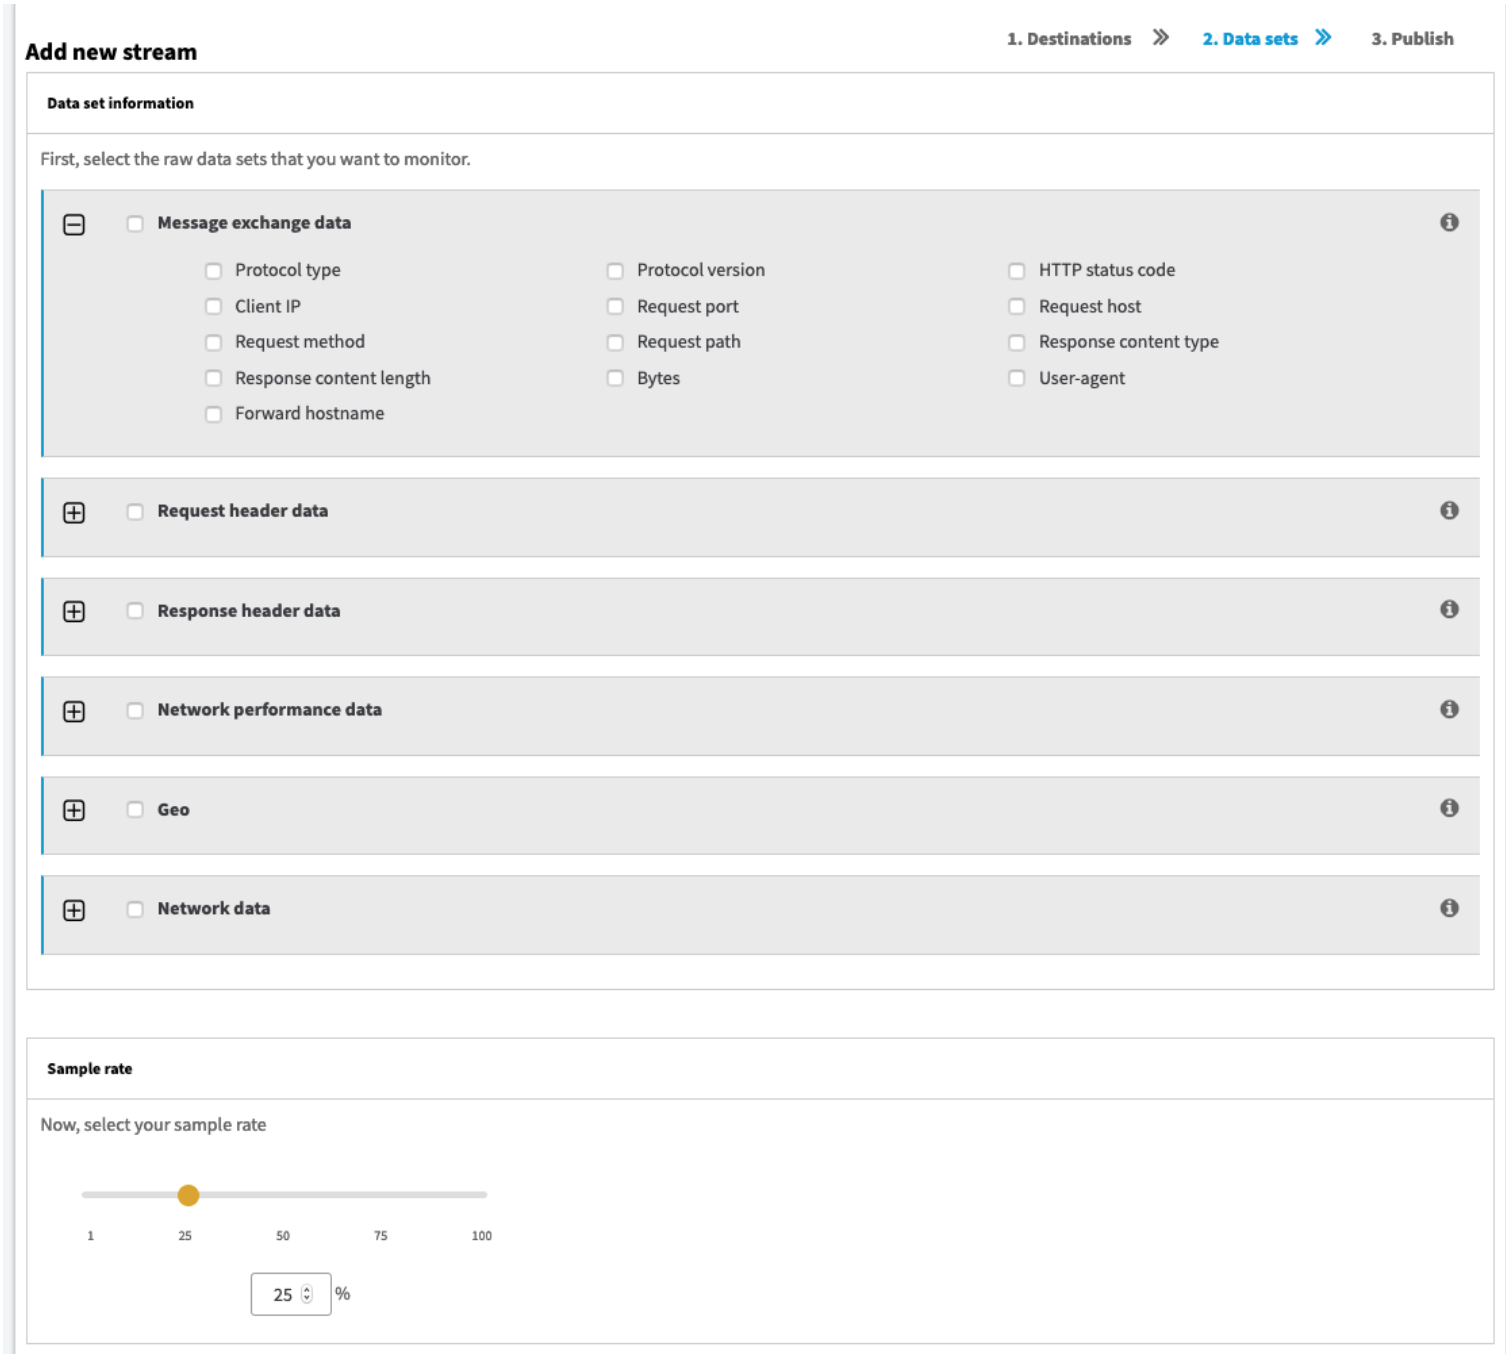
- Continue to the data set and you can then pick and choose which data sets and metrics you want to monitor. You may also want to increase the sample rate to 100%.
 |
|---|
| Figure 4: Selecting the data sets, metrics and the sample rate. |
- Review your configuration and stream settings and if you’re happy with it just publish it. It should a few minutes to propagate over the platform.
- Follow the same steps for configuring a stream for Aggregated Metrics.
Note: Depending on the DataStream version you may or may not have to add the “DataStream behaviour” to the delivery property. A newer version of DataStream allows you to link the delivery property through the Stream Management interface. However, for the older version and in order you can get some data, you need to add the DataStream Behaviour to the property.
How To Configure Sumo Logic
Sumo Logic offers free accounts for individuals and teams looking to try out Sumo Logic for small projects, for an unlimited period.
- So the first step is to sign up for their service and create an account.
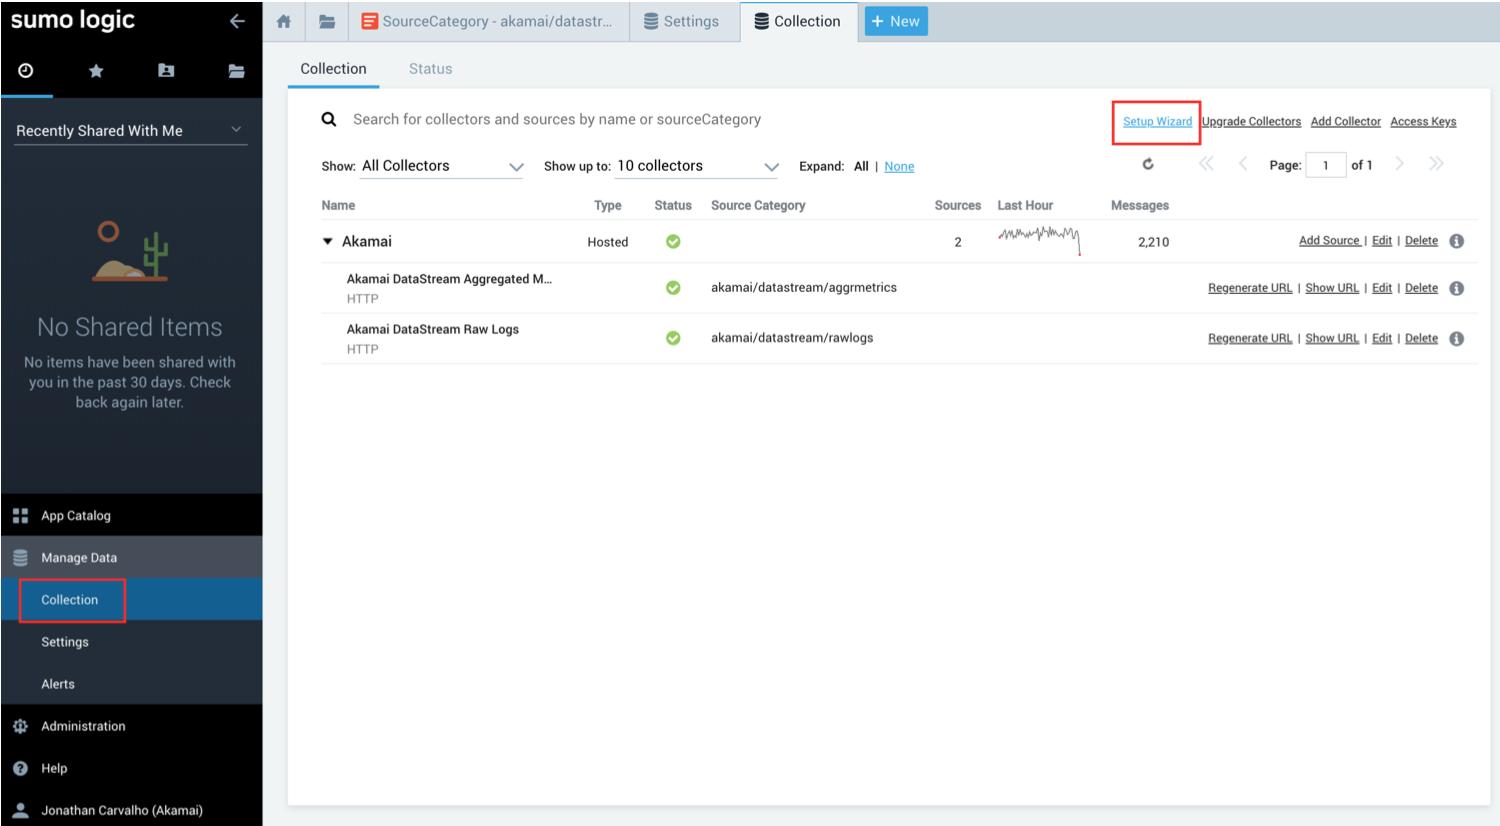
- Once you are logged in, start the Setup Wizard – one way to do this is by going to the “Manage Data” tab on the left-hand side and then “Collection”.
 |
|---|
| Figure 5: Configuring a Sumo Logic Collector for DataStream. |
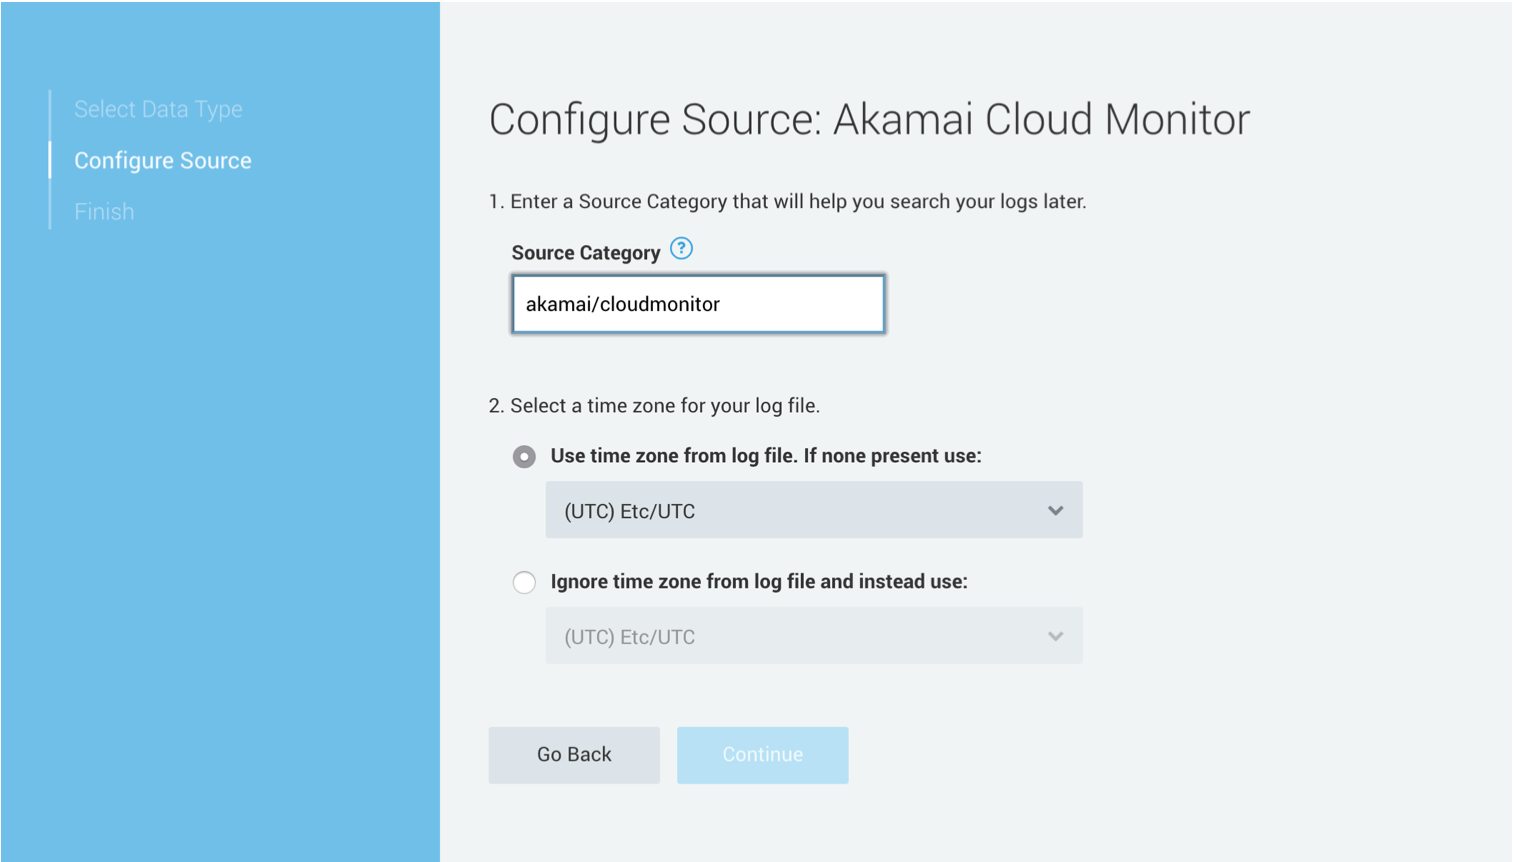
- Click on “Set up Stream Data” and select the Akamai Cloud Monitor Connector (This is the same as setting up an HTTP Source). You can put a name to the source category that it’s more intuitive (example: akamai/datastream/rawlogs and/or akamai/datastream/aggrmetrics) and you can select if you use the time zone from the logs or ignore them. Click “Continue” once you are done.
 |
|---|
| Figure 6: Configuring DataStream Source. |
- Finally, you will get the HTTP Source URL that needs to be added to your DataStream configuration as the endpoint URL.
- After some time, Sumo Logic will start displaying the data pushed by DataStream.
Note: I would recommend you set up an Endpoint URL for the Raw Logs and another one for the Aggregated Metrics.
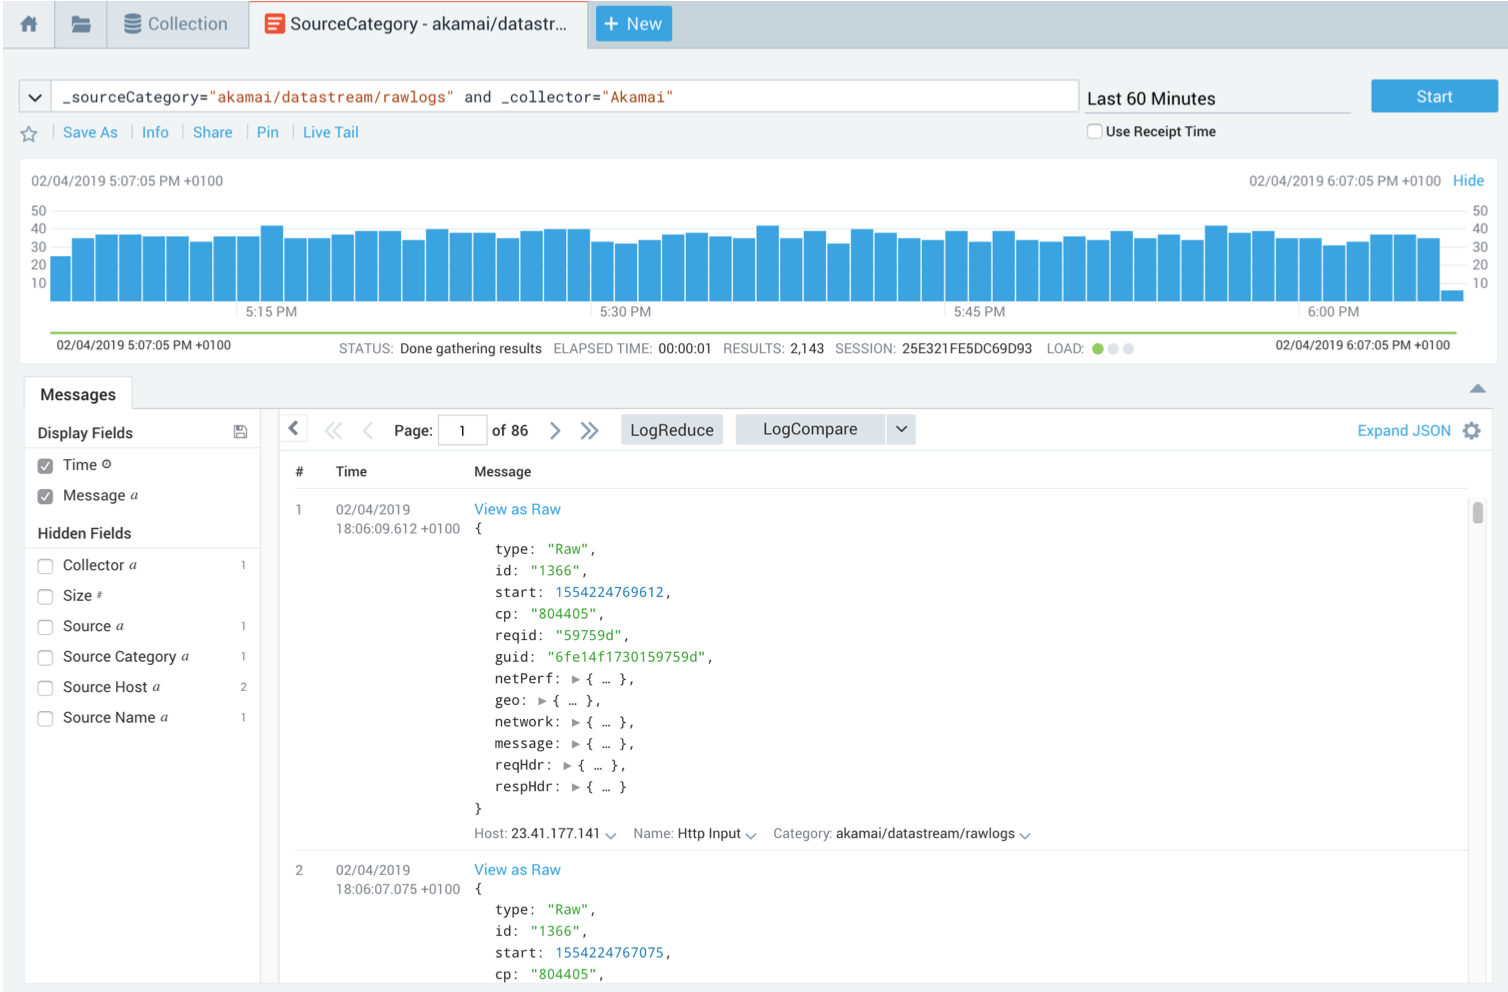
If you then open the Source Category in the Log search you will see the data.
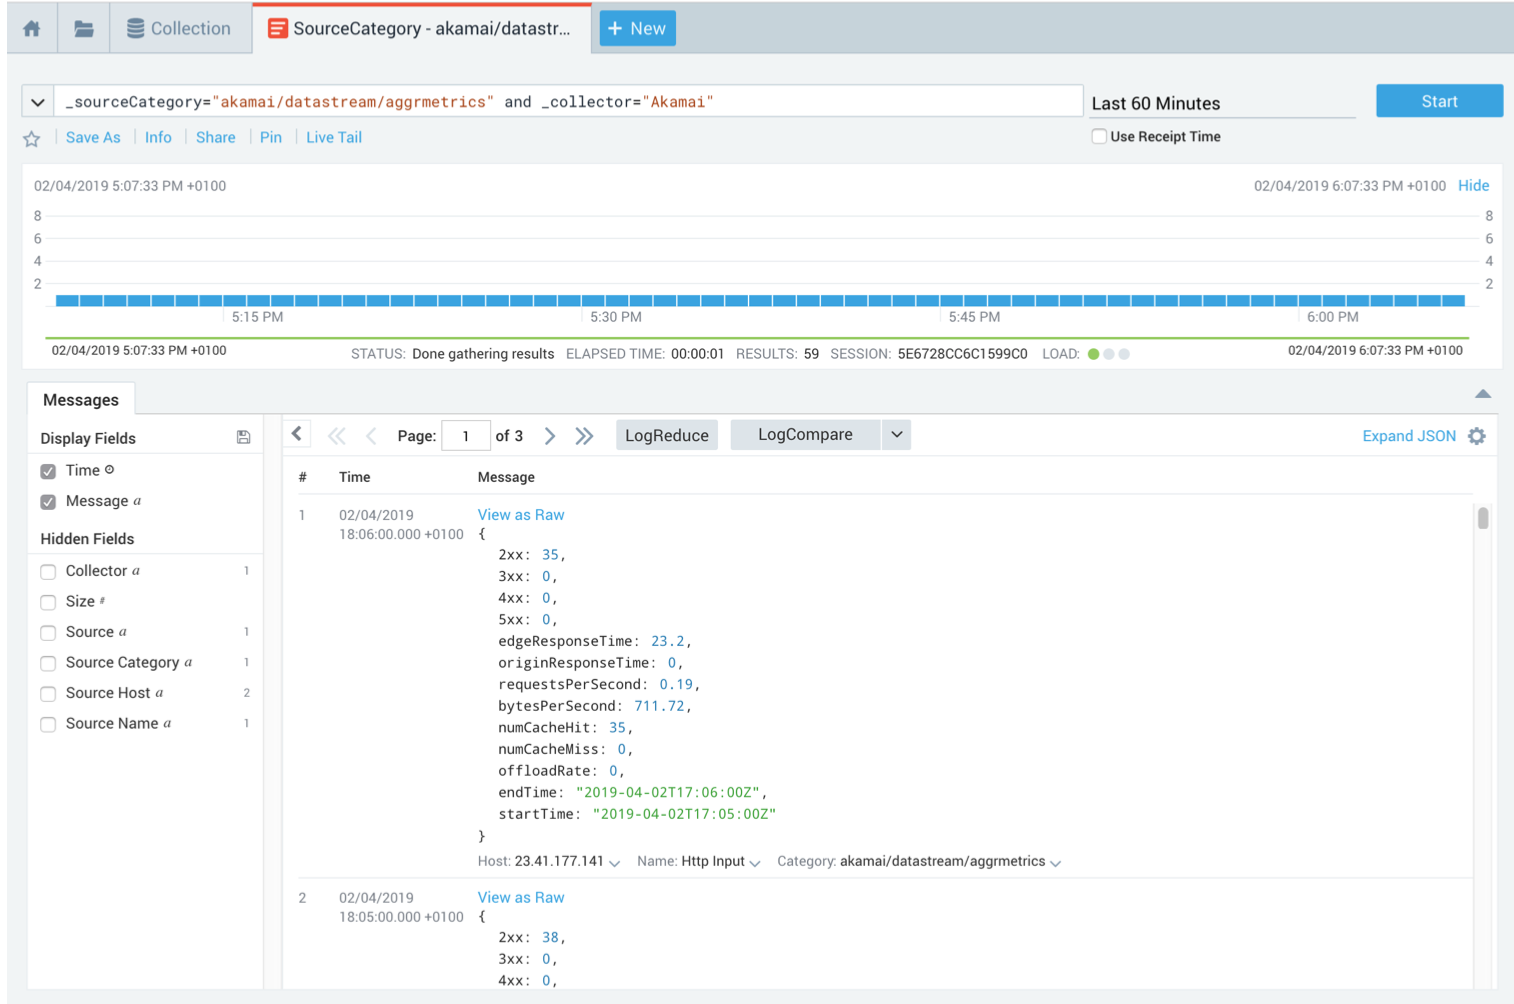
Figure 7 shows the raw logs and Figure 8 shows aggregated data.
 |
|---|
| Figure 7: Raw Logs in Sumo Logic. |
 |
|---|
| Figure 8: Aggregated Metrics in Sumo Logic. |
Using the Akamai OPEN APIs
You may also want to use the Akamai OPEN APIs on a pull model instead of a push model.
Example of the API call for my stream with Raw Logs:
~ ❯ http --auth-type edgegrid -a default: :"/ datastream-pull-api/v1/streams/1366/raw-logs? start=2019-04-01T08:30:00Z&end=2019-04-02T18:20:00Z&page=1&size=10"
Example of the API call for my stream with aggregated metrics:
~ ❯ http --auth-type edgegrid -a default: :"/ datastream-pull-api/v1/streams/1367/aggregate-logs? start=2019-03-01T08:30:00Z&end=2019-04-02T18:20:00Z&aggregateMetric=2xx,3xx,4xx"
Summary
DataStream is very easy to set up and allows users to gather real-time data for quick analysis and troubleshooting. Although there is a variety of metrics, there is no option for custom metrics yet.
What’s next?
The next blog post will cover Akamai’s Image Manager and how to use it to improve both image and video delivery.